Mikael Cugnet
French Atomic and Alernative Energy Commission (CEA)
Whether in cell phones, hybrid/electric vehicles or airplanes, batteries have become virtually indispensable to modern life. Traditional means of evaluating battery performance with advanced chemistries such as lithium-ion don’t provide sufficient information to allow researchers to better optimize them. Thus, they are turning to simulation software to get a deeper understanding of what is going on inside the cells, information they can use in the design of batteries that are more reliable and safe.
EIS and ECM Methods Used Primarily Until Now

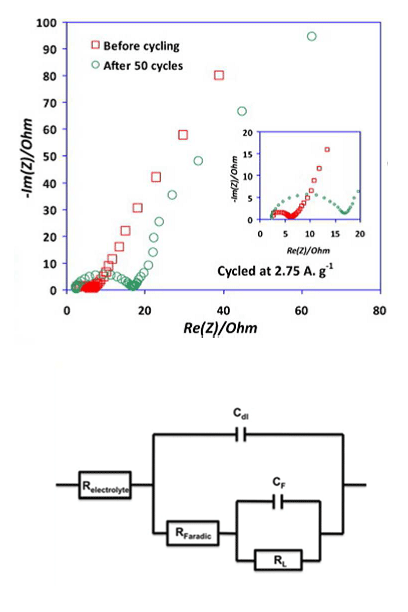
In vehicles, battery management systems (BMSs) are designed to protect the battery, predict vehicle range and update the range prediction depending on driving conditions. These BMSs use circuit models often derived from electrochemical impedance spectroscopy (EIS), a widely used technique to characterize batteries. With readings from an EIS system, it is possible to construct an electronic component model (ECM) that consists of resistances and capacitors connected both in series and in parallel (see Figure 1, bottom). With the results from an ECM study (see Figure 1, top) you can, for instance, determine a battery’s internal resistance, which in turn dictates how much energy it can deliver: is it good enough to propel a vehicle, enough to light up an emergency exit sign, or enough to power a cell phone? Some people attempt to get additional information from used batteries, but it is understandably difficult to do an accurate study on a burned-out battery.
With an ECM, you get component values that mix the contributions of various phenomena occurring in the cell. However, there is a gap between the meaning of the electrical components in the equivalent circuit models and the physical equations characterizing the batteries. In our case, an ECM does not provide any information about important cell properties like the electrode active material resistance, the reaction rate, the specific capacitance, and the diffusion coefficient. We can get this information from a multiphysics model.
Realistic Multiphysics Simulation
Rather than work with an equivalent circuit model, we at INES decided to create a physics-based model of a LiFePO4/Li half cell. Its output is likewise a plot of impedance vs. frequency so we could compare its results to those of EIS measurements for verification. This model, though, gives us a great deal more information that we can use in the design of batteries that are more reliable and safe.

Because I am very familiar with the equations governing battery behavior, I built my own model from scratch in COMSOL Multiphysics to give me full control of all parameters and even deeper understanding from the simulation.
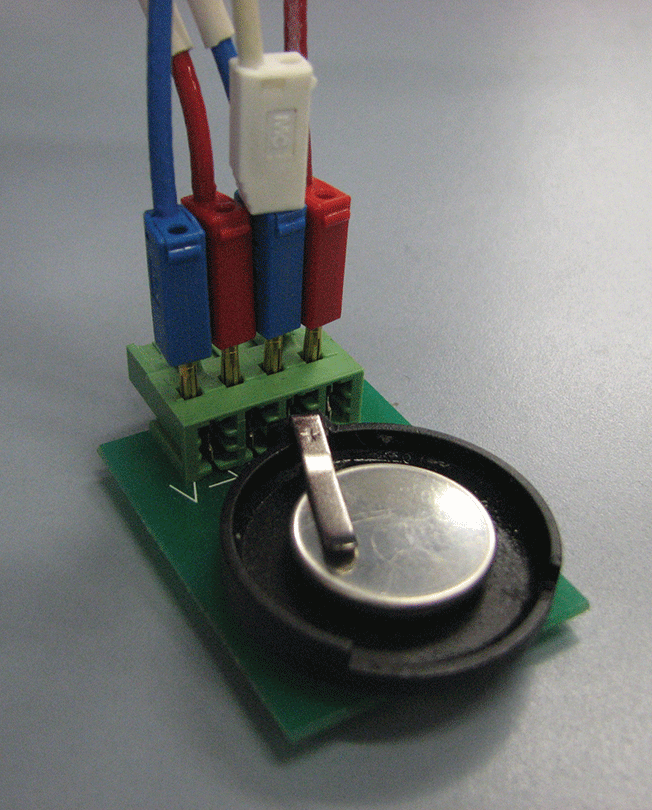
The physical battery model is a half cell in the shape of a button battery (see Figure 2). I need to study the half cell rather than a conventional battery in order to separate the electrodes and get a more precise evaluation of their physical properties; if I were to work with a complete cell, I would get a mix of all the phenomena occurring in each electrode without knowing which electrode I should attribute the resulting parameter values.
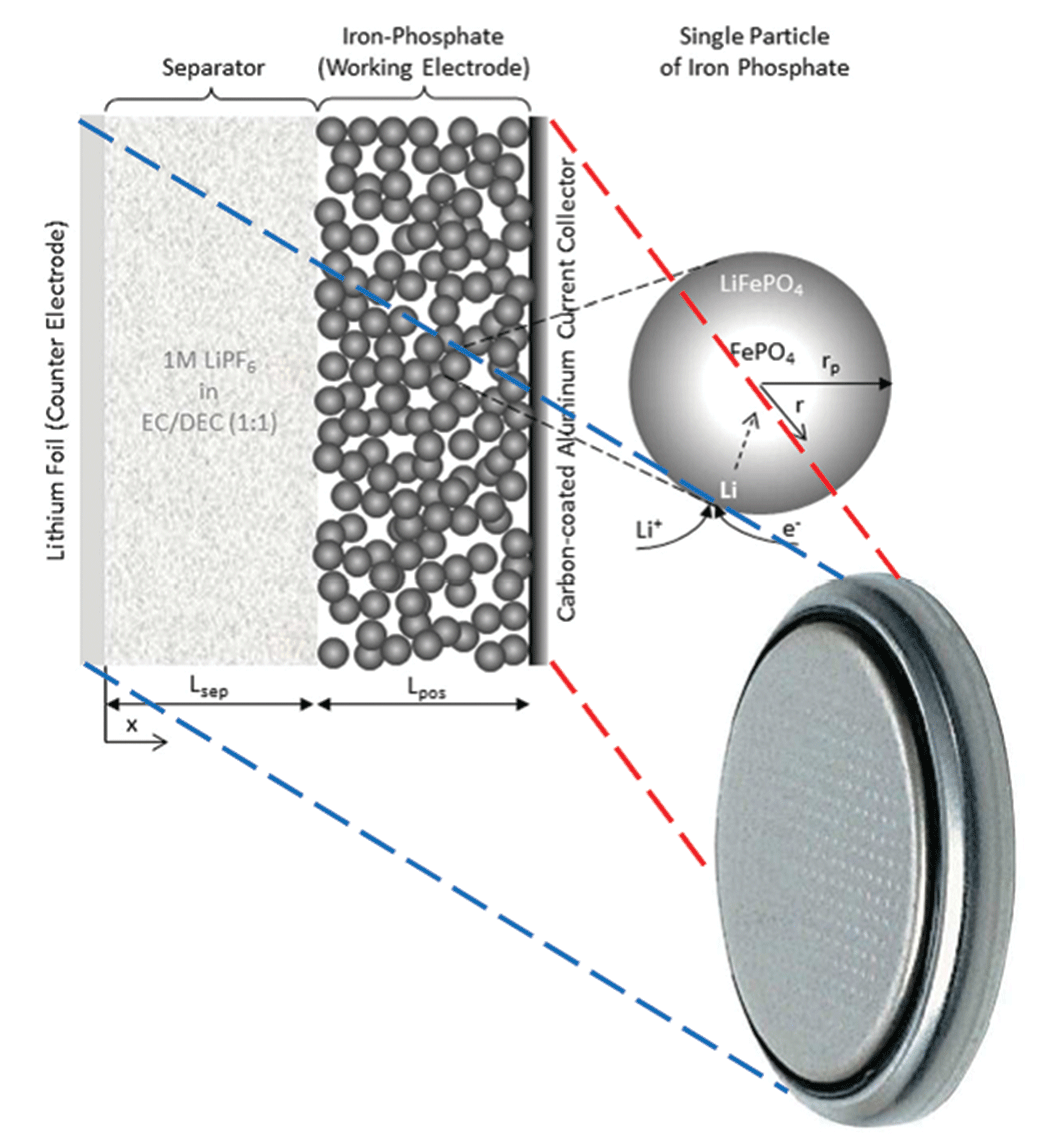
The corresponding simulation actually consists of two coupled 1D models (see Figure 3). The first model represents the macroscopic level. It is made up of two domains: the working electrode, plus the separator between the iron-phosphate electrode and the lithium foil, which also serves as the counter-electrode (see Figure 3, left). The second model represents the microscopic level, which has only one domain. It models a spherical particle of iron phosphate, which is the main component of the working electrode’s active material (see Figure 3, right).

Everything Done with PDEs Entered Through the GUI
Both models were created exclusively with partial differential equations (PDEs). The macroscopic model uses equations for the conservation of current for the electronically conducting solid phase, the conservation of current for the ionically conducting liquid phase, and the material balance on the salt LiPF6 dissolved in the liquid phase. These three equations then couple into the microscopic model equation, which is Fick’s Law characterizing solid-state diffusion of the reduced-lithium species in the particle.
All the model equations are time- dependent, so it is not possible to derive the impedances for the plot directly from the equations. Doing so would require that you assume they are linear, which I didn’t want to do because they are in fact nonlinear and non-stationary. Next, I wanted to simulate how the system physically behaves when you stimulate it with sine waves of various frequencies. Thus, it is necessary to run the model at each sinusoidal-excitation frequency and read the results. I measure six points per decade from 10 mHz to 200 kHz, and the total simulation run takes 15 minutes.
To run the model for each frequency we saved the model as an M-file readable by MATLAB. We then ran LiveLink for MATLAB to process the results to get the full impedance spectrum of the half-cell.
The inputs to the model are the cell’s state of charge, set to 100 percent; the magnitude of the sinusoidal excitation voltage (7.1 mV centered around the cell’s equilibrium potential of 3.490 V); and the frequency of the excitation (from 10 mHz to 200 kHz). The model outputs are the cell current in response to the excitation voltage, the potentials in the electronically conducting solid phase and ionically conducting liquid phase, and the concentration of lithium ions in the solid phase (with the microscopic model) and the liquid phase (with the macroscopic model).
The Importance of the Electric Double Layer

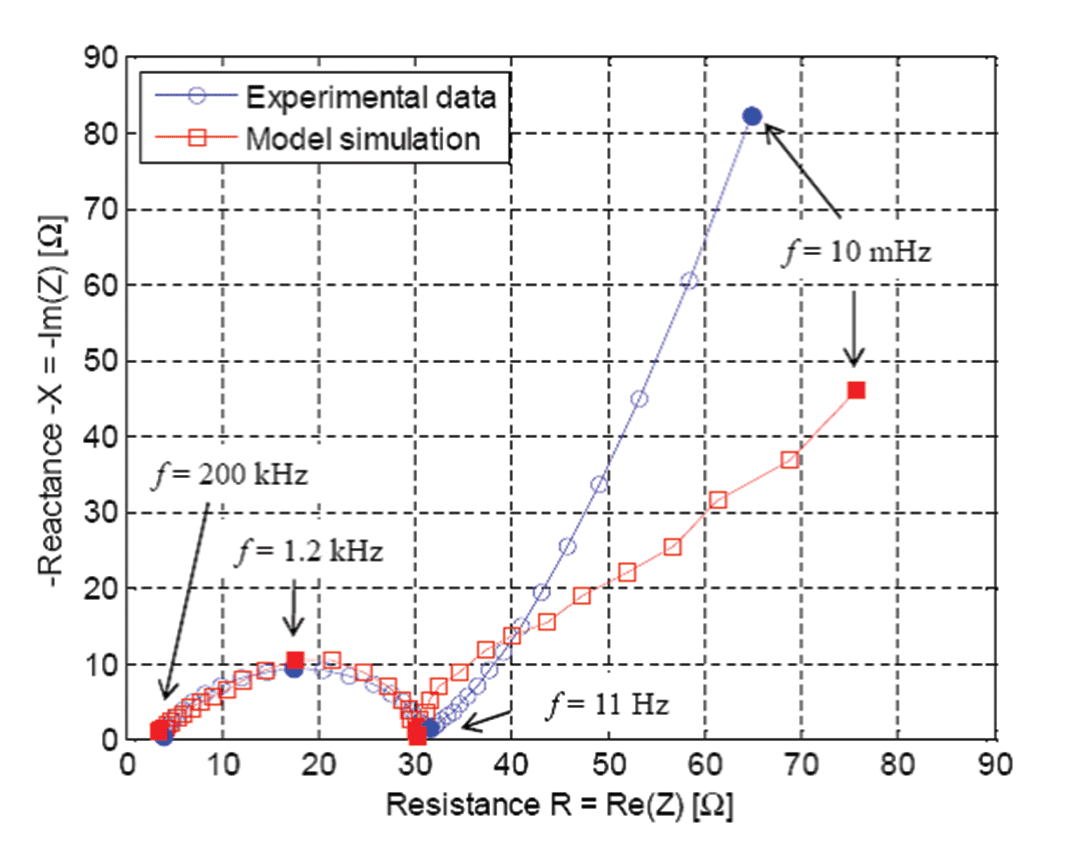
One feature of COMSOL Multiphysics that proved essential was the electrical double layer (EDL). In all Li-ion battery models in the literature, the current density localized at the interface between the particle surface and the liquid includes only the Butler-Volmer equation for electrode kinetics. Despite the use of this equation, the semicircle at the left of Figure 4 characterizing charge transfer does not appear because such models cannot predict it. This happens because all the PDEs in the model behave like a pure resistance at frequencies higher than 10 Hz. However, things change when you add the EDL because you add a capacitive component in addition to the reaction rate equation. This somewhat corresponds to a capacitor connected in parallel to a resistance. Since I wanted to accurately mimic what happens in my half cell, I added this component in the PDEs in order to take EDL into account.
Figure 4 shows the optimized values of some key parameters I was able to identify at specific frequencies. First, I did a sensitivity analysis of my model for those specific frequencies, which means I investigated the impact of the variation of my model parameter values on the impedance. Then I found out that for each frequency I had to adjust a specific parameter in order to get a good match with my experimental data. Finally, to get those optimized values, I wrote a MATLAB program using an optimization function coming from the Optimization Toolbox coupled with my simulation from COMSOL Multiphysics. It is important to get those optimized values because they provide information on the value of critical cell properties, such as the active material resistance, reaction rate, EDL capacitance and diffusivity of ions.
Taking the Next Step Towards a Better Understanding Of Batteries
Our simulation results are useful for obtaining some critical physical values. Specifically, at this stage I can clearly see that the active material used in my electrode indeed has poor electronic conductivity. I can also see that the capacitive behavior of the cell is far from being negligible at frequencies higher than 10 Hz. This means that the EDL must be taken into account if you want to model the cell behavior during pulse operation or specific usage profiles. In terms of resistance, the weakest part has been identified as the charge transfer resistance resulting from the reaction rate.
In the impedance spectrum, you might notice that the curves at low frequencies (right side) deviate somewhat. This shows what happens because the active material particle scale is not well described in our approach. We do not yet know what is responsible for this effect, perhaps a missing phenomenon somewhere in the model, or some parameter values must be adjusted. This is the focus of our current work.
For more information, please visit www.cea.fr/english-portal.


